
The term “Clean Tech” was coined over a decade ago, as the initial phase of investment in the Clean Technology, Clean Energy and Renewable Energy industries began. This initial phase of industrial development started with great hope and aspirations. The desire to create an industry, which could both “Save the Planet” and at the same time, offer meaningful economic benefits to its entrepreneurs, financial investors and shareholders drove this ebullient period. That initial growth phase saw billions of dollars poured into new companies and new technologies by both the public and private sectors around the world. Leading venture capitalists, investment banks and a supportive Administration, “fueled” the Clean Tech fire further, by providing the capital needed to jump start growth in this exciting new industrial sector.
However, the financial markets and political environments of 2008, quickly changed as the “Great Recession” began. Many Clean Tech & Renewables companies quickly felt the impact of this severe economic downturn. The amount of investment in new companies and technologies quickly shrank. The promise of greater energy independence and “Clean Tech” as the new growth engine for the U.S. economy quickly evaporated. Many clean technology investors came up short, as many of the technologies created during the initial phase of clean tech development were unable to survive commercially. Many of these companies will now need to be refinanced, in one form or another, sold in an M&A transaction or ultimately restructured.
This recent experience has made “Clean Tech” a dirty word in many investors’ minds. Many who invested in the “boom” have more recently found their investments underwater and their companies in need of additional capital. The slower-than-expected growth in real customer demand for many Clean Tech products and services, quickly revalued the near-term financial prospects for many Clean Tech companies.
It is our observation that with many new technology “boom and busts”, the “pioneers” tend to get “killed by the natives”, while it is the “settlers” who ultimately benefit from this outsized technology spend going forward. We believe that the sector entering the “settler” phase and is poised for a rebound. That being said, investors increasingly demand not just promising technology directed at sustainability, but real sustainable business models that offer investors a way to be better compensated for their investment risk. One has to believe that government subsidies will continue to shrink, as the need to balance the budget in Washington takes an overwhelming priority. Hence, the need for businesses that make fundamental economic sense today, will be a paramount consideration for investors in the near term.
We clearly expect 2013 to be a period of continued rebuilding in Clean Tech & Renewables. However, the sector is preparing for its second phase of development. Refinancing will continue to take an increasing role and M&A opportunities will continue to emerge, as these new companies continue to need capital to fund their growth. Project Finance will continue to lead in Clean Tech financing activities in the short-tem, as the deployment of large-scale wind and solar projects around the globe, have actually begun to deploy. At the same time, economic recovery has and will continue to strengthen. We believe that the resulting recovery in Clean Tech will offer investors significant opportunities over the next 5-10 years. At the same time, it seems clear that recovery in the sector near term, will primarily occur in those sub-sectors with the ability to create a sustainable business models. The fundamentals of businesses such as LED Lighting, Solar, Environmental Services, Water & Waste among others seem to be emerging as the leading candidates poised for near-term growth.
Overall, the Clean Tech & Renewables sector and its associated markets will remain increasingly important to the overall global economy, as a growing solution for the insatiable worldwide demand for energy. The German government recently estimated that the worldwide market for green technology has grown by 11.8% a year on average since 2007, and is now worth over EUR 2.0 (USD$ 2.6) trillion. By 2025, it expects that these markets will more than double to EUR 4.4 (USD$ 5.7) trillion. As the overall demand for energy continues to increase in the Developed World, the accelerating growth of the emerging and developing markets will only add to demand growth in the sector. Clean Tech & Renewable energy will become a greater and greater piece of the total global energy solution. The need to deliver greater energy efficiency to our daily and industrial lives will drive long-term secular growth.
As we initiate coverage in the sector and begin a regular and rigorous discussion of the Clean Tech & Renewables sector, we would like to share the business segments we will initially cover. The following components and sub-sectors will be included:
- Solar
- Wind & Geothermal
- Energy Efficiency
- Green Transportation
- Natural Gas & Bio-Fuels
- Water & Waste
- Environmental Services
Clean Tech & Renewables is in many respects an “emerging market”, still young and developing. We expect to both broaden and deepen coverage over time, as the Clean Tech recovery develops.
Year in Review
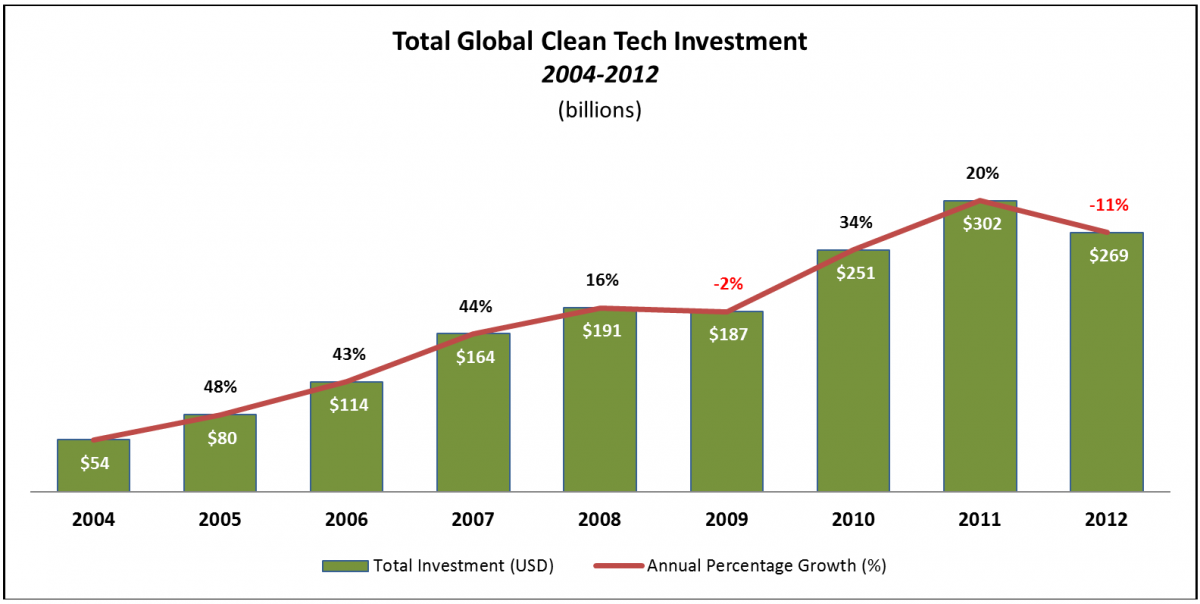
2012 proved to be a more robust year for total investment in Clean Tech on a global basis, than many investors expected. The years of 2010 and 2011 saw an initial rebound in Clean Tech financings, coming off a dismal 2009. However, in 2012 as the economy failed to mount a meaningful recovery, financing activities stalled once again, with a decline of 11% overall versus 2011. Despite this decline, 2012 was the second highest year of Total Investment in the sector since 2004. Below is a chart of Total Investment in Clean Tech from 2004 through 2012:
The largest component of Clean Tech Investment during the fourth quarter continued to be Project/Asset Finance, which continue to dominate the financial landscape in Clean Tech. The charts that follow summarize Project/Asset Finance activities in the Clean Tech sector by both Region and Sub-Sector, during the fourth quarter of 2012.
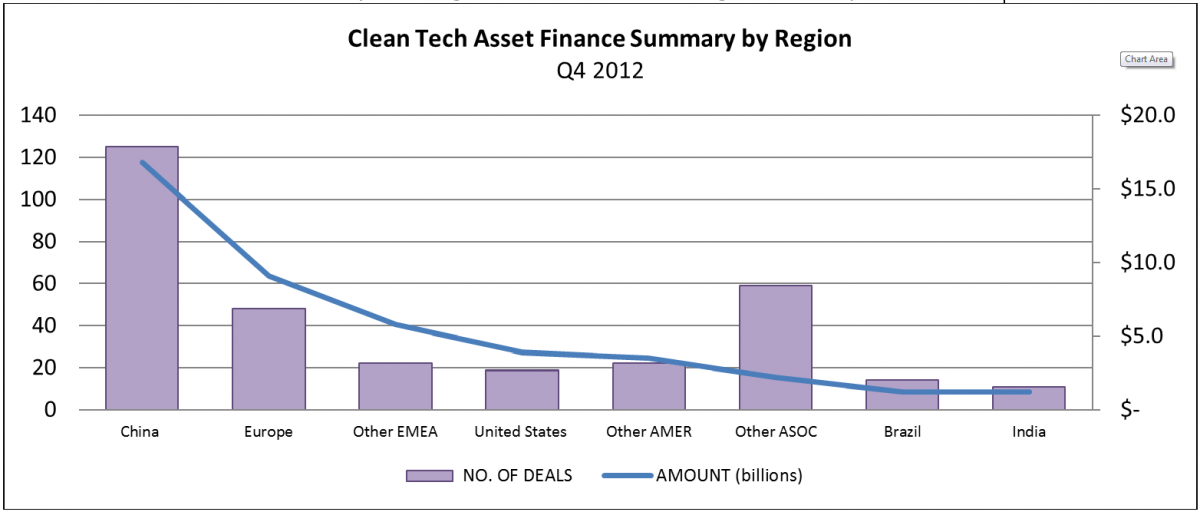
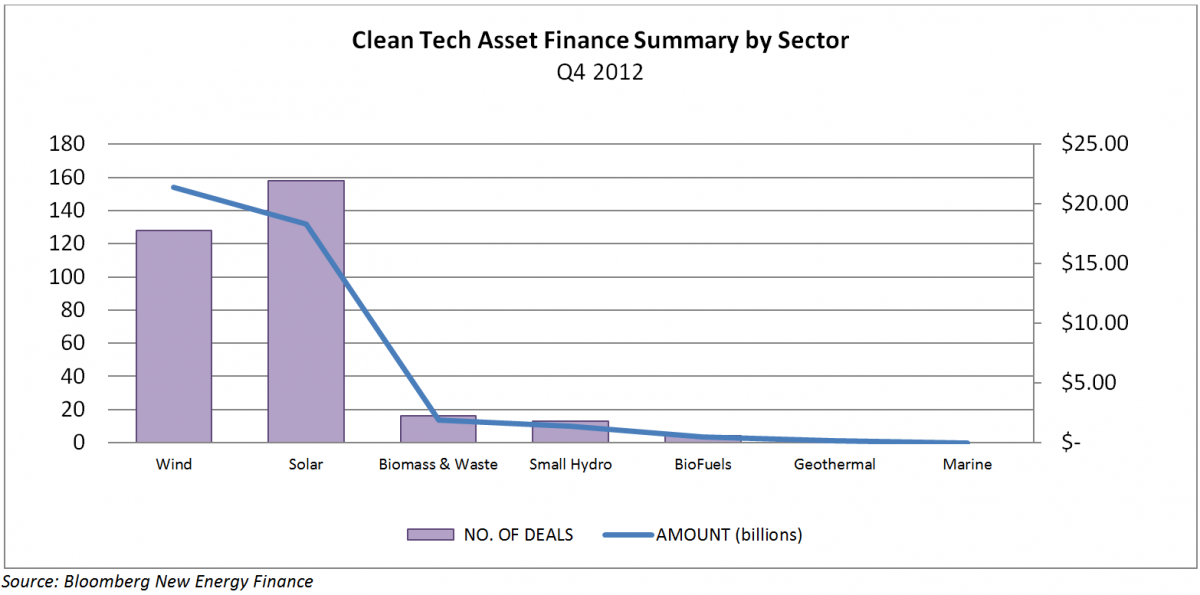
The data above show Project/Asset Finance activity in the fourth quarter primarily occurred to support Renewable Energy projects in China, Europe, Asia, the Middle East, and South America. The United States ranked fifth in this analysis. To no one’s surprise, Wind and Solar projects accounted for most of the activity, distantly followed by Biomass & Waste, Small Hydro and BioFuel projects.
In contrast to the activity experienced in Project/Asset Finance during the fourth quarter of 2012, Venture Capital & Private Equity (VC & PE) transactions display a stark difference in both Regional and Sector focus. The chart below shows VC & PE investment in the Clean Tech sector during the fourth quarter of 2012.
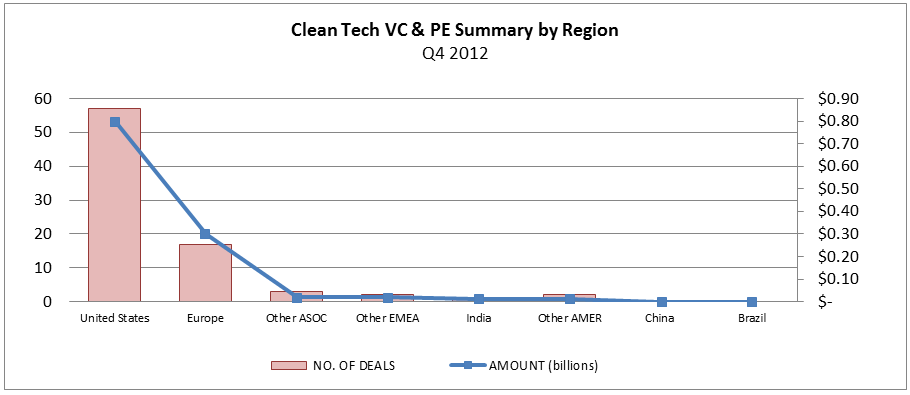
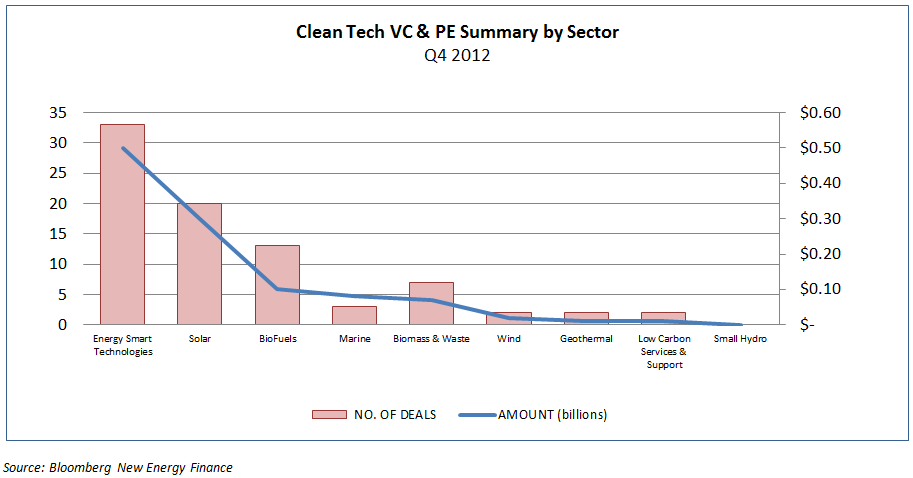
The data show the U.S. and Europe accounted for the vast majority of Venture Capital and Private Equity activity in the Clean Tech & Renewables sector, both in number of deals and amount invested. The top three sub-sectors attracting VC & PE investment in the fourth quarter of 2012 were Energy Smart Technologies, Solar and BioFuels. Biomass & Waste was a close fourth.
Acquisition activity in Clean Energy during 2012 paused after a more robust 2010-2011 period. Corporate M&A in the sector continued to slow throughout 2012 as well. In fact, 2012 was the slowest year for Corporate M&A in Clean Tech since 2005. Asset Acquisitions and Refinancings slowed in the middle of the year, but finished strong, remaining the largest component of total Acquisition Transactions. Below are charts showing the trends in Acquisition Transactions, Corporate M&A and Asset Acquisitions & Refinancings, quarterly since 2004.
![]()
We expect refinancing and asset acquisition activity to continue at a reasonable pace. Survivors are beginning to emerge in this sector, albeit in specific segments.
Below is a list of notable Corporate Finance, M&A and IPO transactions during 2012 in the Clean Tech & Renewables sector:
![]()
Public Comparable Companies
Although, we do not expect the public markets to quickly re-embrace the Clean Tech & Renewable sector in the near term, several public Clean Tech companies have survived the downturn, amidst a sea of poor operating results for most publically traded participants. Although not show below, some large traditional companies who also have a presence industrially in Clean Tech, such as GE, Siemens, Phillips or Borg Warner have meaningful roles to play as these industries develops. Below is a partial list of U.S. publicly traded companies in the Clean Tech & Renewables space where there is consistent data available:
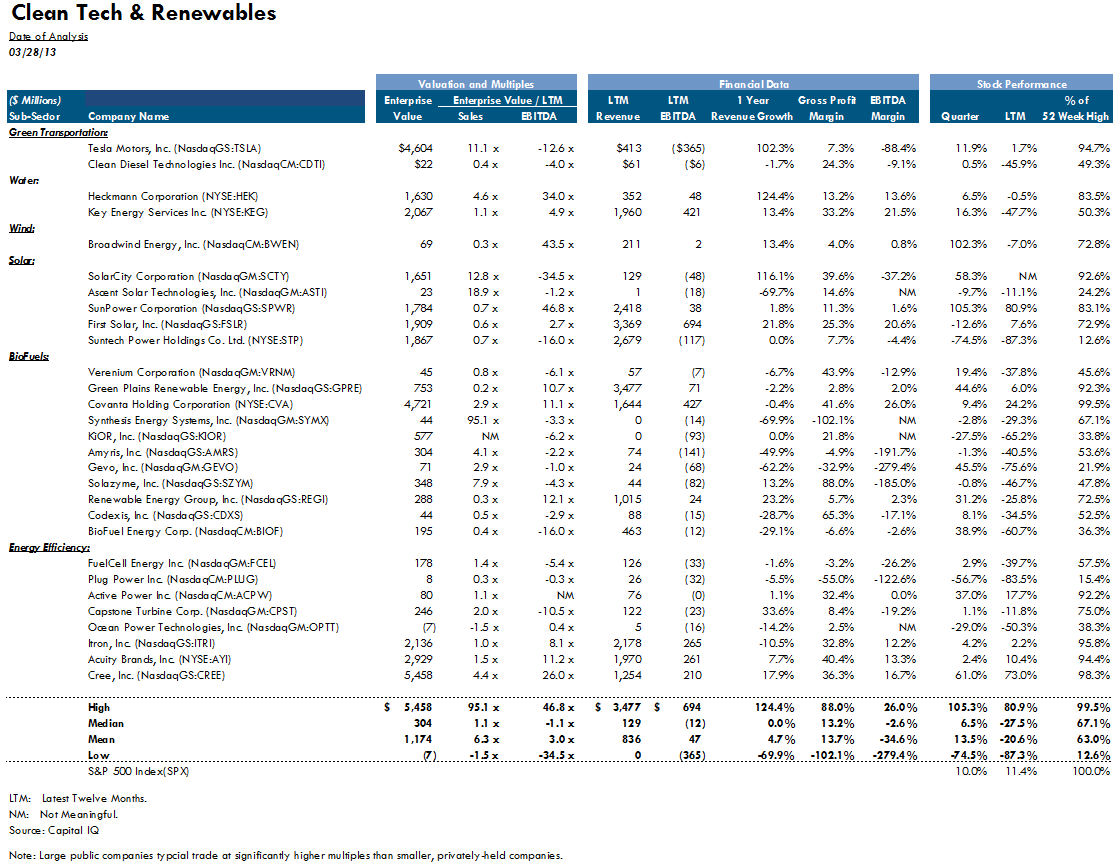
The table above demonstrates that negative EBITDA is not an uncommon site among publically traded companies in this sector. Despite this phenomenon, we believe that several factors will positively affect the earnings potential for many companies in the Clean Tech & Renewables sector. Continued technological development is now resulting in decreased costs for many such companies.These changing economics are leading to increased market demand in many subsectors, such as Solar, LED Lighting, and Enterprise Energy Management and Advanced Fuel Cells. Large amounts of additional BioFuel capacity is expected to come online over the next year, as well as Clean Tech companies serving the harvesting of Natural Gas reserves in the U.S., also expect increased demand.
Sector Highlight
Energy Efficiency – LED Lighting
One area that deserves current attention is Solid State Lighting or LED Lighting. The actual conversion from incandescent and/or CFL-based lighting to LED-based lighting has clearly begun. The initial growth in LED applications began with applications such as industrial lasers, optics, traffic lights and LED backlighting for Television. LED applications in General Lighting, have been led primarily by commercial adoption, although consumer appetites for LED technology will grow as costs continue to fall and prices become more competitive versus traditional lighting. “Intelligent Lighting” will also rapidly develop, as the digital infrastructure provided by solid-state lighting, offers a perfect platform to both collect and distribute information connected to digitally based energy management systems and other information technology applications. We believe that the LED Lighting sector will offer investors a compelling near-term opportunity. Several business factors that we believe are important when evaluating opportunities in the LED Lighting industry today are:
- Defensible, Proprietary IP
- Defensible Market Niche(s)
- Solid & Experienced Management Team
- Focused on Non-Commodity Businesses
- Focused on Fixtures vs. Replacement Bulbs
- Strong Market Demand today for its Products
- Strong Value Proposition for the End Market
We expect both strategic and financial buyers to continue to be active in the LED Lighting industry. With a sharp expected decline in the lighting replacement cycle, there is a race to grab market share quickly. Private Equity firms are actively “rolling up” complementary LED Lighting assets creating larger companies that can more effectively compete for lower costs from the supply chain, from contract manufacturers (primarily in Asia), thus allowing the companies to build scale, making them more attractive to the larger strategic players in the space. Strategic Investors such as Phillips, OSRAM/Sylvania, GE, Toshiba, Samsung, Acuity Brands and CREE have both the brand and distribution muscle to apply to LED Lighting in the long-term. However, many small LED companies today are rapidly developing leading-edge product more quickly than their larger strategic competitors. We also expect strategic buyers, particularly from Asia, to be interested in acquiring LED-driven lighting companies in the U.S. market, in order to gain direct access to the North American markets, as well as U.S. brands and distribution. We believe this phenomenon will offer continued M&A opportunities in the industry.
Below is a chart showing the breakdown of the total investments made during 2012 in Energy Efficiency products and services. Lighting continues to attract the most investment, as we believe that the prospect for highly profitable business models continue to develop in LED Lighting.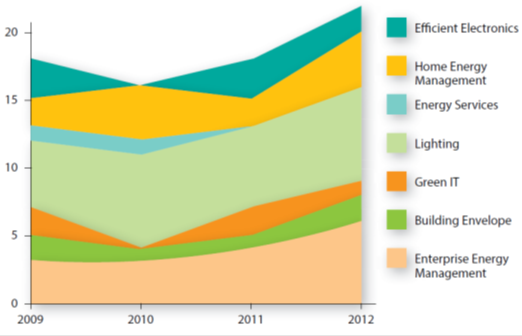
Source: The Clean Tech Group; Global Clean Tech 100, 2012
Clean Tech & Renewables Team
Recent Clean Tech & Renewables Transactions
Notice & Disclaimer
These materials were prepared by Westbury Group, LLC (“Westbury”), a broker-dealer registered with the Securities and Exchange Commission (“SEC” at www.sec.gov) and a member of the Financial Industry Regulatory (“FINRA” at www.finra.org) and the Securities Investor Protection Corporation (“SIPC” at www.sipc.org).
Westbury may act as investment banker to specific companies in the industry sectors described in this report by providing merger, acquisition, divestiture, private placement and other advisory services.
Westbury gathers its data from sources it considers reliable. However, it does not guarantee the accuracy or completeness of the information provided in this report. The material provided herein reflects information known to the authors at the time this report was written and such information is subject to change. Westbury makes no representations or warranties, expressed or implied, regarding the accuracy or completeness of this report.
Information, opinions and any estimates contained in this report reflect Westbury’s judgment as of the date written and are subject to change without notice. Westbury undertakes no obligation to notify any recipient of this report of any such change.
This report does not constitute advice or a recommendation, offer or solicitation with respect to the securities of any company discussed herein, is not intended to provide information upon which to base an investment decision, and should not be construed as such. Officers, directors, partners and employees of Westbury and its affiliates may have positions in the securities of the companies discussed, if any.
This report is not directed to, or intended for distribution to, any person in any jurisdiction where such distribution would be contrary to law or regulation.
Any public companies presented in this report are companies commonly used for industry information to show performance within a sector. They do not include all public companies that could be characterized within the identified sector and do not constitute recommendations for a particular security or sector. The charts, graphs and tables used in this report have been compiled by Westbury solely for the purposed of illustration.